
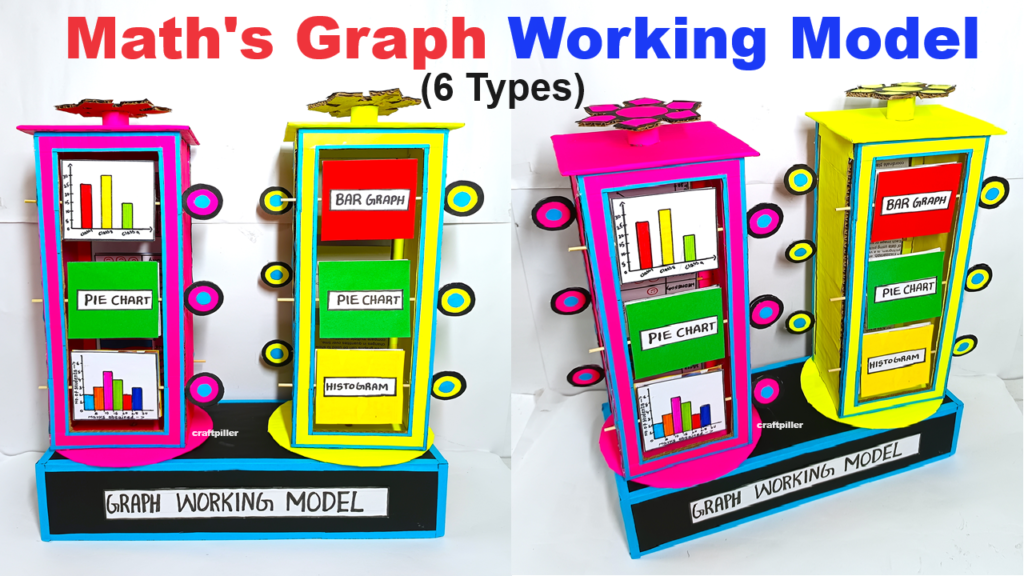
Objective
To create a rotating model displaying different types of graphs: line graph, histogram, bar graph, pie chart, pictograph, and area graph using chopsticks and cardboard for a math’s exhibition.
Materials Needed
- Large square cardboard pieces
- Chopsticks (or wooden dowels)
- Markers, pens, colored paper
- Glue or tape
- Scissors
- Nut and bolt (to act as the pivot)
- Labels for each graph type
- Protractor and ruler (for accurate graph drawing)
- Compass (for drawing circles)
Step by Step Video Instructions
Step 1: Prepare the Circular Base
- Cut the Cardboard Circles:
- Cut out two large circles from the cardboard, each with a diameter of about 18 inches.
Step 2: Create the Graph Bases
- Cut Smaller Cardboard Pieces:
- Cut six smaller cardboard pieces (approximately 8×8 inches each). These will be the bases for each type of graph.
- Draw the Graphs:
- Line Graph: Draw a simple line graph with labeled axes and a line representing data points.
- Histogram: Draw a histogram with bars representing frequency of data intervals.
- Bar Graph: Draw a bar graph with labeled axes and bars representing different data categories.
- Pie Chart: Draw a pie chart divided into segments representing data proportions.
- Pictograph: Draw a pictograph with symbols representing data quantities.
- Area Graph: Draw an area graph with colored areas representing cumulative data over time.
- Decorate and Label:
- Use markers and colored paper to decorate and clearly label each graph.
Step 3: Attach the Graphs to the Circular Base
- Position the Graph Bases:
- Position each smaller cardboard piece (graph base) on a corresponding segment of the large circular base.
- Attach the Graphs:
- Glue or tape each graph base onto the segments of the large circular cardboard. Ensure they are securely attached.
Step 4: Assemble the Rotatable Model
- Attach the Chopsticks:
- Attach chopsticks or wooden dowels to the back of each large circular cardboard piece to act as support arms. You will need two chopsticks for each graph (12 in total).
- Create the Rotating Mechanism:
- Pierce a hole through the center of both large circular cardboard pieces.
- Insert a bolt through the center holes and secure it with a nut, allowing the circular pieces to rotate independently.
Step 5: Final Assembly
- Align the Circles:
- Stack the two large circles on top of each other, aligning the segments so that each type of graph can be viewed by rotating the top circle.
- Secure the Model:
- Ensure that the bolt is tight enough to hold the circles together but loose enough to allow smooth rotation.
Step 6: Decoration and Labels
- Add Labels:
- Label the center of the top circle with “Types of Graphs.”
- Label each segment on the top circle with the corresponding graph type.
- Finishing Touches:
- Decorate the edges and center of the model to make it visually appealing for the exhibition.
Conclusion
This rotatable working model provides a hands-on, visual method to showcase different types of graphs.
By rotating the top circle, students can easily switch between and observe the different graph types, making it an interactive and engaging tool for learning about data representation