
Introduction:
In the realm of mathematics, statistics stands as a powerful tool for unraveling the mysteries hidden within data.
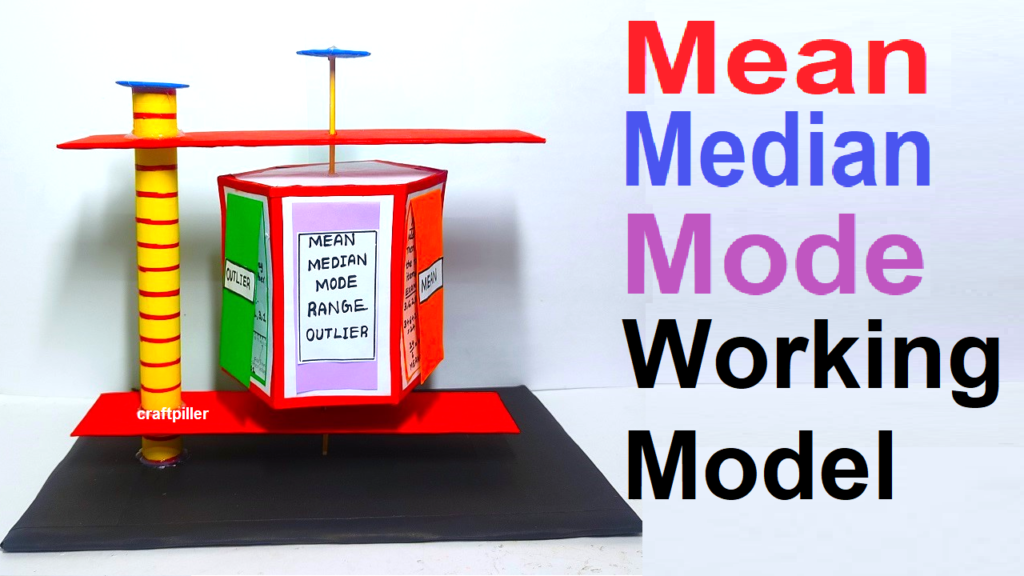
Mean, Median, Mode, Outlier, and Range are five key measures that provide valuable insights into the central tendencies and variations present in a dataset.
Together, they form the bedrock of statistical analysis, aiding in the interpretation of data with precision and clarity.
Creating a Mean, Median, Mode, Outlier, and Range working model using cardboard and colored paper is a fantastic way to make these mathematical concepts tangible and visually understandable. Here’s how you can go about it:
Materials Needed:
- Cardboard sheets (for the base and labels)
- Colored paper (for data points)
- Ruler, pencil, and scissors
- Marker or pen
- Glue, tape, and stapler
- Small containers (for storing data points)
Steps:
Setting up the Base:
- Create the Base Structure:
- Cut out a large rectangular piece of cardboard to serve as the base. This will be the foundation for your working model.
- Label the Sections:
- Divide the base into five sections, one for each concept (Mean, Median, Mode, Outlier, and Range). Use cardboard strips or labels to clearly mark each section.
Representing Data Points:
- Cut Out Data Points:
- Cut out a set of colored paper squares or circles to represent your data points. Use a variety of colors and sizes to make it visually interesting.
- Label the Data Points:
- Assign numerical values to each data point and write them on the corresponding colored paper pieces. For example, use a marker to write numbers like 8, 12, 15, 20, etc.
- Organize the Data Points:
- Arrange the data points in a scattered pattern within the designated sections on the base. This simulates a dataset.
Working on Mean:
- Calculate the Mean:
- Using the labeled data points, calculate the mean by adding up all the values and dividing by the total number of data points. Write down the formula and result on a cardboard label in the “Mean” section.
Working on Median:
- Arrange Data Points for Median:
- Arrange the data points in ascending or descending order within the “Median” section. If there’s an even number of data points, add one more to the set to demonstrate finding the middle value.
- Locate the Median:
- Show how to find the median by identifying the middle value. If there’s an even number of data points, demonstrate how to find the average of the two middle values.
Working on Mode:
- Identify the Mode:
- Within the “Mode” section, find and label the mode(s) of the dataset. If there’s no mode, mention that the dataset is without a mode.
Working on Outlier:
- Add an Outlier:
- Introduce an outlier by placing a data point that significantly deviates from the rest within the “Outlier” section. Label it accordingly.
Working on Range:
- Calculate the Range:
- Explain how to calculate the range by finding the difference between the highest and lowest values. Write down the formula and result in the “Range” section.
Final Touches:
- Secure the Data Points:
- Glue or tape the data points onto the base to keep them in place.
- Label and Explain:
- Label each section with its respective concept (Mean, Median, Mode, Outlier, Range) and provide a brief explanation of how it’s calculated.
This working model effectively brings these mathematical concepts to life, providing a hands-on learning experience for students to understand Mean, Median, Mode, Outlier, and Range visually.