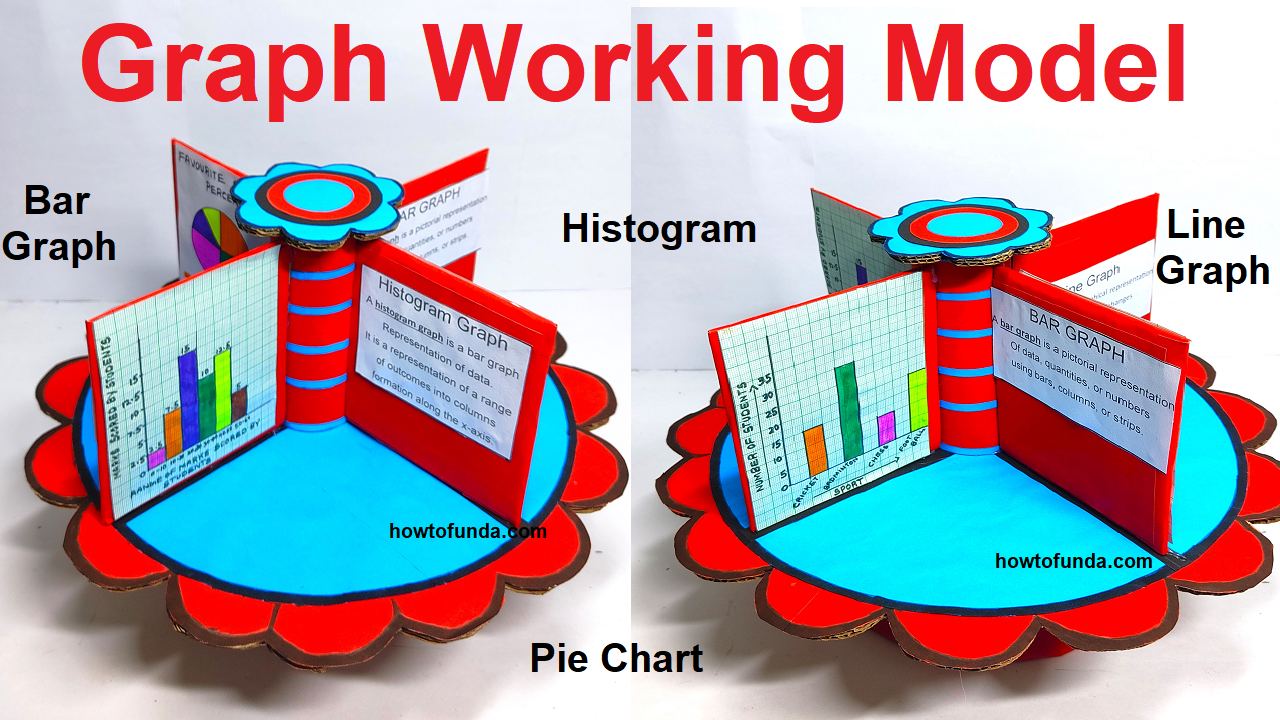
Creating a math graph working model that includes a bar graph, histogram, line graph, and pie chart with a rotating mechanism and four partitions using cardboard can be an engaging and interactive project.

Below is a step-by-step guide to help you build this comprehensive math graph model:
Materials Needed:
- Cardboard
- Ruler
- Pencil
- Craft knife or scissors
- Colored paper or markers
- Compass (optional)
- Protractor
- String or yarn
- Small brads or paper fasteners
- Glue or tape
Steps to Create the Math Graph Working Model:
Step 1: Prepare the Base:
- Cut a large piece of cardboard to serve as the base for your model. This will be the foundation for the rotating mechanism.
Step 2: Create Four Partitions:
- Cut the cardboard into four equal partitions. Use a ruler to ensure accuracy.
Step 3: Create Rotating Mechanism:
- Connect the four partitions in the center using small brads or paper fasteners, allowing them to rotate freely. This forms a square with four movable parts.
Step 4: Draw Graphs on Each Partition:
- Bar Graph: On one partition, draw a bar graph with labeled axes and bars representing different data points. You can use colored paper or markers for this.
- Histogram: On another partition, draw a histogram. Ensure the bars touch each other, representing continuous data intervals.
- Line Graph: On the third partition, draw a line graph with labeled axes, connecting points to represent trends over time or other variables.
- Pie Chart: On the fourth partition, draw a pie chart using a compass or protractor. Label each section with percentages or data values.
Step 5: Attach Strings for Rotation:
- Attach a piece of string or yarn to each partition. Ensure the strings are of equal length and connect them at the center. This allows for easy rotation of the graphs.
Step 6: Display and Demonstrate:
- Set up your math graph working model at the exhibition table.
- Rotate the strings to display each type of graph and explain the concepts behind bar graphs, histograms, line graphs, and pie charts.
This math graph working model provides a dynamic and comprehensive representation of various types of graphs commonly used in mathematics. It’s a creative and educational display that allows viewers to actively engage with different graphing techniques.