
Introduction
This working model is designed to explain the four important concepts of data handling:
- Mean
- Median
- Mode
- Range
Instead of only writing formulas, this model uses a rotating flower-type display and a sliding answer window, making learning visual, interactive, and easy to understand.
Aim of the Model
The main aim of this model is to:
- Help students understand what Mean, Median, Mode, and Range actually represent
- Show how these values are found from a given data set
- Make statistics simple, interesting, and memorable
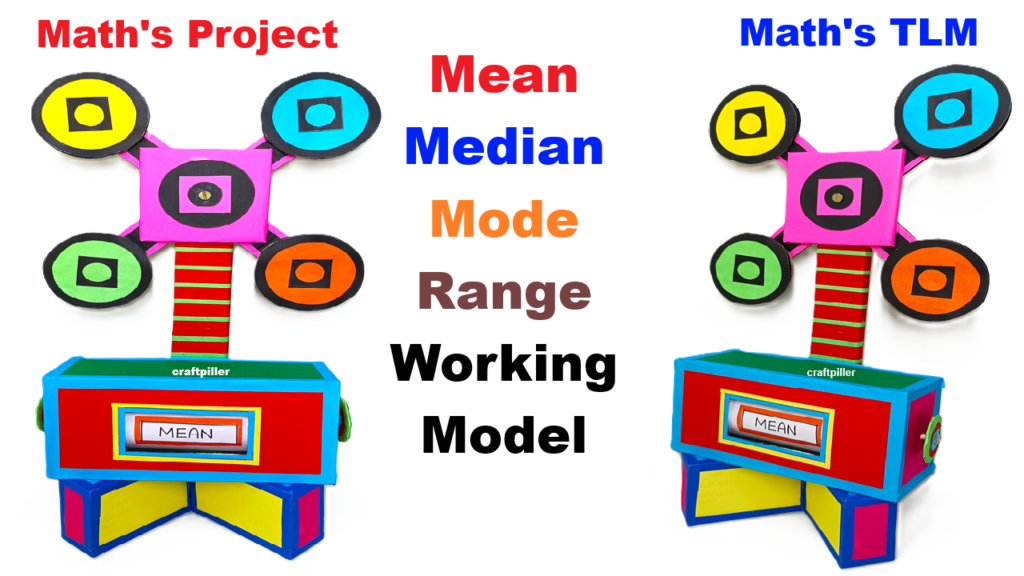
Main Parts of the Model
1. Base and Display Box
- The bottom part is a rectangular display box
- It has a sliding window in the front
- The window shows the selected concept:
- Mean
- Median
- Mode
- Range
2. Vertical Support Stand
- A vertical stand connects the base to the top
- It supports the rotating structure
- Gives height and attraction to the model
3. Rotating Flower (Top Section)
- The top part looks like a four-petal flower
- Each petal represents one concept:
- Yellow → Mean
- Blue → Median
- Orange → Mode
- Green → Range
- The flower rotates using a split pin or axle
How the Model Works (Step-by-Step)
Step 1: Given Data Set
A fixed data set is assumed in the model, for example:
2, 4, 6, 6, 8, 10
This same data is used to explain all four concepts.
Step 2: Rotating the Flower
- The student rotates the top flower
- One concept comes to the front position
- At the same time, the sliding strip inside the box moves
Step 3: Display Window Shows the Concept
- When Mean is selected → “MEAN” appears
- When Median is selected → “MEDIAN” appears
- When Mode is selected → “MODE” appears
- When Range is selected → “RANGE” appears
This makes the model interactive and self-explanatory.
Concept-Wise Explanation Using the Model
1. Mean (Average)
Definition:
Mean is the average of all values.
Explanation using model:
- Add all numbers in the data
- Divide by total number of values
Example:
(2 + 4 + 6 + 6 + 8 + 10) ÷ 6 = 6
👉 When the Mean petal is selected, the display shows MEAN
2. Median (Middle Value)
Definition:
Median is the middle value when data is arranged in order.
Explanation using model:
- Arrange data in ascending order
- Find the middle number
Example:
2, 4, 6, 6, 8, 10
Middle values = 6 and 6
Median = 6
👉 When the Median petal is selected, the display shows MEDIAN
3. Mode (Most Frequent Value)
Definition:
Mode is the number that occurs most frequently.
Explanation using model:
- Check which number repeats the most
Example:
6 occurs twice
Mode = 6
👉 When the Mode petal is selected, the display shows MODE
4. Range (Difference)
Definition:
Range is the difference between the highest and lowest values.
Explanation using model:
Highest value = 10
Lowest value = 2
Range = 10 − 2 = 8
👉 When the Range petal is selected, the display shows RANGE
Why This Model Is Called a “Working Model”
- It has moving parts
- The flower rotates
- The display changes automatically
- Students can interact and learn by doing
Conclusion
This Mean, Median, Mode & Range Working Model converts abstract statistical concepts into a simple hands-on learning experience.
By rotating the flower and observing the display, students can clearly understand the meaning and application of each measure of central tendency. It is an excellent model for maths exhibitions, classroom teaching, and competitions.