
Learn how to make a Coordinate Geometry Working Model for Maths Exhibition, School Projects, and TLM (Teaching Learning Material).
This simple DIY project clearly explains the X-axis, Y-axis, Quadrants, Coordinate Points, and Signs of Coordinates.
MATERIALS REQUIRED
- Chart paper (yellow / any light color)
- Graph sheet
- Colored papers (for quadrants)
- Black sketch pen
- Cardboard circle (base of the graph)
- Ice-cream sticks
- Small plastic/wooden stand or pipe
- Round thermocol/ cardboard base
- Glue, scissors, scale
STEP-BY-STEP MAKING PROCESS
Step 1: Make the Circular Graph Board
- Cut a circle from cardboard (approx. 20–25 cm diameter).
- Paste a graph sheet on the circle neatly.
- Trim the edges to match the circular shape.
- You can also color it lightly (yellow) for a clean look.
Step 2: Draw the Coordinate Axes
- Use a scale and black marker.
- Draw the X-axis horizontally through the center.
- Draw the Y-axis vertically through the center.
- Mark positive and negative numbers clearly on both axes.
- Right side = +X
- Left side = –X
- Upwards = +Y
- Downwards = –Y
Step 3: Mark Example Points on the Graph
Write few coordinate examples:
- (4, 5) in Quadrant I
- (–3, 4) in Quadrant II
- (–5, –3) in Quadrant III
- (6, –4) in Quadrant IV
Place them correctly on the graph with small dots.
Step 4: Make Quadrant Labels
- Cut 4 small circles from colored paper (red, blue, yellow, pink).
- Write the quadrant names:
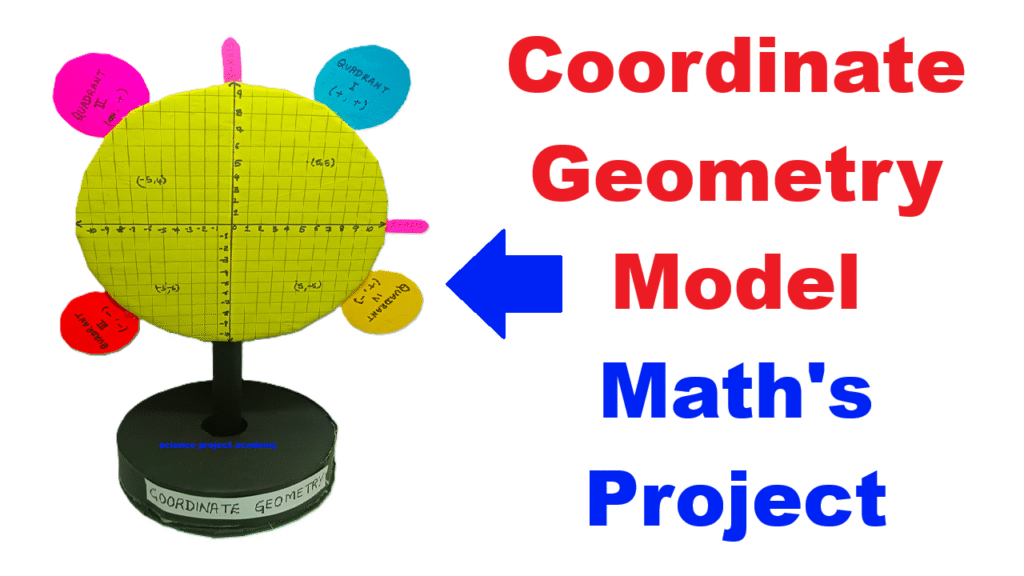
- Quadrant I (+, +)
- Quadrant II (–, +)
- Quadrant III (–, –)
- Quadrant IV (+, –)
- Attach each circle onto an ice-cream stick.
- Paste these sticks behind the graph so that they come out like petals (just like the image).
Step 5: Make the Base Stand
- Take a round piece of cardboard or thermocol for the bottom base.
- Color it black (optional).
- Attach a small pipe, wooden stick, or thick cardboard roll vertically in the center.
- Fix the graph circle on top of the stick.
Step 6: Add Labels on the Base
Write “Coordinate Geometry Model” on a strip of white paper and paste it on the base.