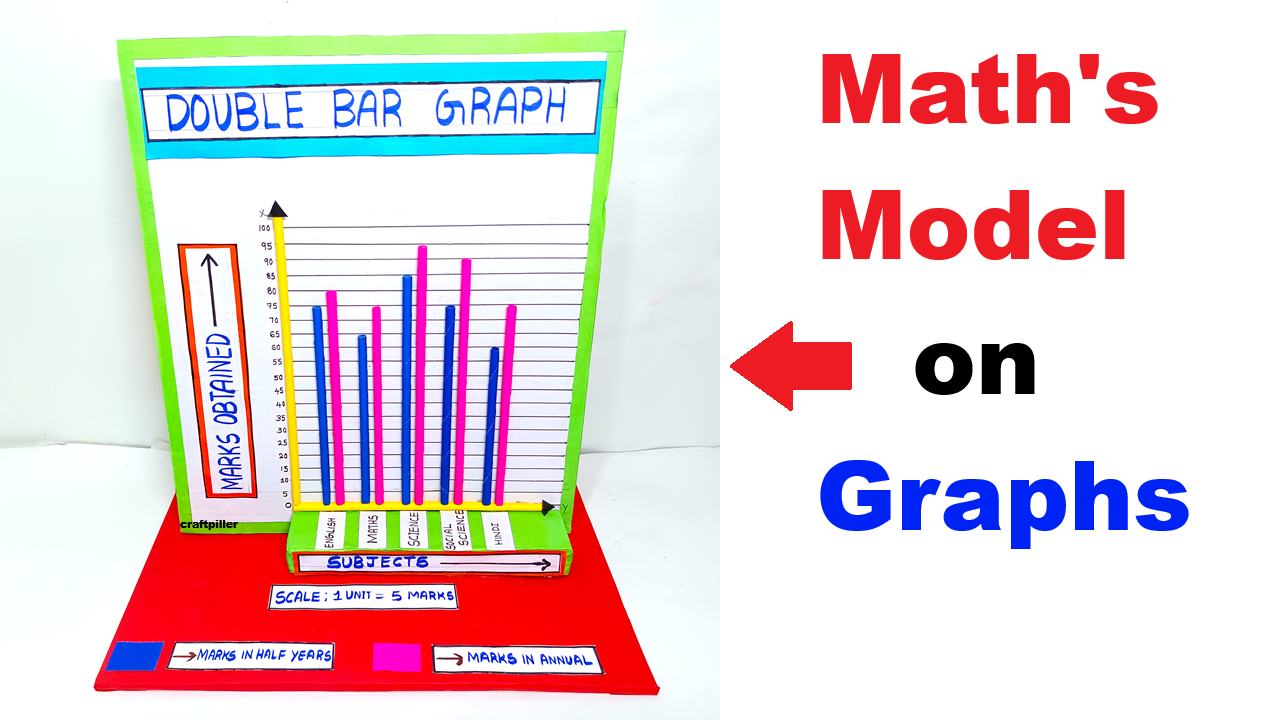
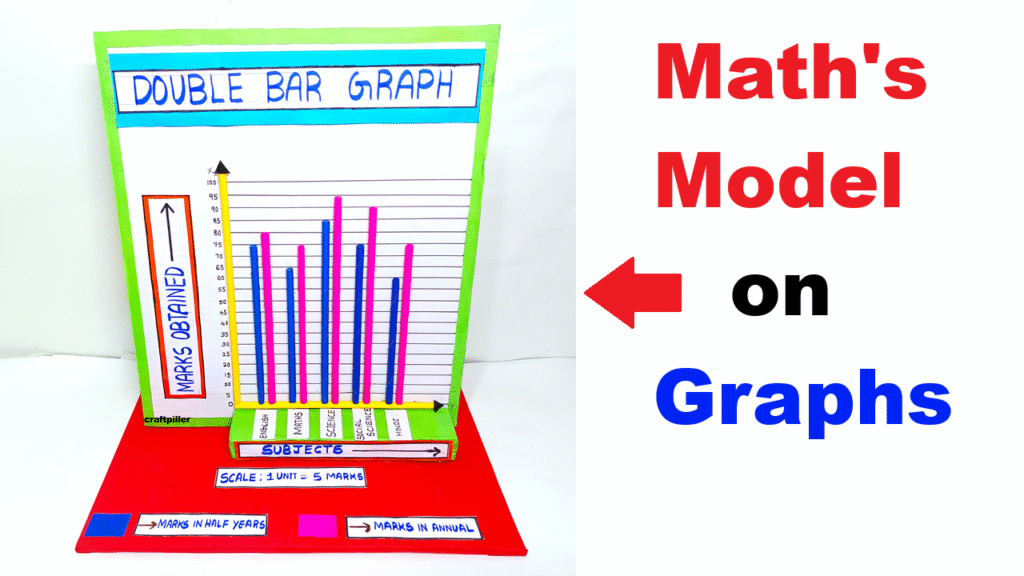
In this video, you will learn how to make a Double Bar Graph Model for maths exhibition or school project. This model clearly shows comparison of marks in two different exams (Half-yearly vs Annual) using colorful bars, chart paper, and foam sheets.
Materials Needed
- White chart paper (A3 size or large)
- Cardboard sheet (base)
- Foam sheet (green, blue, pink, red)
- Colored sticks / straws / skewers (for bars)
- Scale and pencil
- Sketch pens
- Fevicol / hot glue gun
- Scissors
- Black marker
Step-by-Step Procedure
STEP 1: Prepare the Base
- Take a strong cardboard sheet.
- Cover it with red chart/foam sheet (as shown in the picture).
- This becomes the foundation for the chart to stand.
STEP 2: Make the Main Graph Board
- Take a white chart paper and cut it into a rectangle.
- Draw horizontal ruled lines equally spaced (1 cm or 0.5 cm apart).
- Draw a vertical Y-axis on the left side.
- Draw a horizontal X-axis at the bottom.
STEP 3: Add Border
- Cut green foam sheet strips and stick around the edges of the board to make a neat border.
STEP 4: Label the Y-axis (Marks Obtained)
- Start from 0 at the bottom, then mark 5, 10, 15… up to 100.
- Write “Marks Obtained” vertically on a foam sheet piece and stick it on the left side.
- Draw an upward arrow at the top of the Y-axis.
STEP 5: Label the X-axis (Subjects)
- Prepare foam sheet rectangular pieces and write subject names, e.g.:
- English
- Maths
- Science
- Social
- Hindi
- Stick them horizontally on the bottom of the board.
STEP 6: Draw the Scale Box
- Make a small box below the graph.
- Write:
Scale: 1 Unit = 5 Marks
STEP 7: Prepare the Bars
You need two bars for each subject:
Bar 1 → Marks in Half Yearly (Blue)
Bar 2 → Marks in Annual (Pink)
You can use:
- Colored sticks
- Straws
- Skewers painted with acrylic colors
Cut them to correct length based on marks.
Example:
- If marks are 70, bar height = 70 ÷ 5 = 14 units (14 grid lines)
STEP 8: Paste the Bars
- Apply fevicol/hot glue at the bottom of each stick.
- Stick each bar exactly above its subject label.
- Keep equal spacing between the two bars of each subject.
STEP 9: Add the Main Title
- On a big foam sheet piece, write “DOUBLE BAR GRAPH”
- Stick it on the top center of the chart.
STEP 10: Add the Legends (Color Codes)
At the bottom:
- Blue square → Marks in Half Year
- Pink square → Marks in Annual
Stick the foam pieces and write the labels clearly.
STEP 11: Fix the Graph Board to the Base
- Apply hot glue at the bottom backside of the chart.
- Attach the board standing upright on the base.
- Support the back with a cardboard triangle if needed.