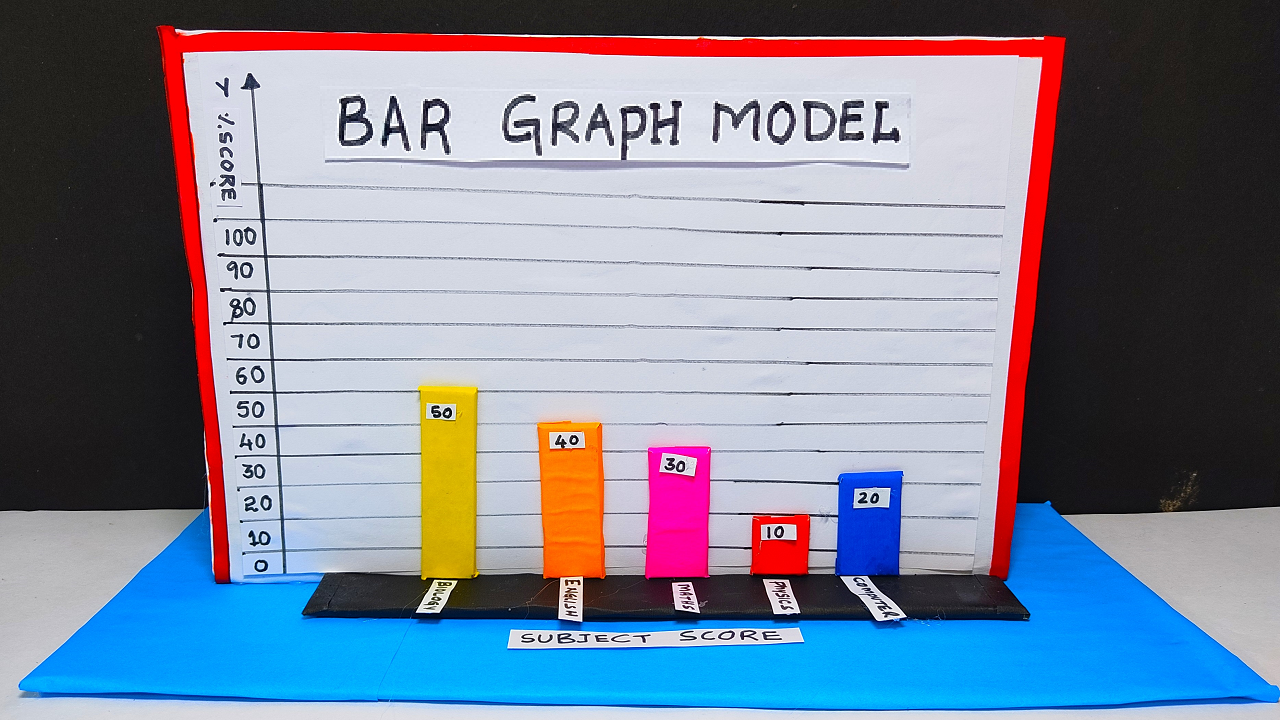
Creating a 3D bar graph model for a science exhibition comparing subject marks versus scored marks is a great way to visually represent data.

Here’s a step-by-step guide using cardboard and color paper:
Materials Needed:
- Cardboard sheets
- Color paper (for bars and labels)
- Ruler
- Pencil
- Craft knife or scissors
- Glue
- Markers
Video Steps by Steps Instructions :
- Plan Your Data:
- Decide on the subjects you want to represent and the corresponding scores.
- Plan the range and scale of your bar graph based on the scores.
- Create the Base:
- Cut a large rectangular piece of cardboard to serve as the base of your 3D graph.
- This represents the overall context or comparison.
- Vertical Strips for Bars:
- Cut several vertical strips from cardboard, each representing a subject.
- The width of each strip should be consistent.
- The length of each strip should correspond to the scores in that subject.
- Color Paper for Bars:
- Cut colored paper to cover each strip, representing the bars of the graph.
- The color can be different for each subject, making it visually appealing.
- Glue the colored paper onto the cardboard strips.
- Add Labels:
- Cut small pieces of color paper to create labels for each subject.
- Write the names of the subjects on the labels.
- Attach the labels at the bottom of each bar.
- 3D Effect:
- To create a 3D effect, cut small rectangles from cardboard.
- Attach these rectangles vertically along the top edge of each colored strip, creating a raised edge.
- This gives the illusion of a three-dimensional bar.
- Score Numbers:
- Cut small rectangles or squares from color paper to represent the scored marks.
- Write the actual scores on these rectangles.
- Attach these rectangles at the top of each bar to indicate the specific scores.
- Display:
- Arrange the bars on the base in a visually appealing way, leaving some space between them.
- Ensure that the labels and scores are clearly visible.
- Graph Title:
- Create a title for your graph using color paper or markers.
- Place the title prominently above the graph.
- Explanatory Text:
- Include a brief explanation or key to help viewers understand the data and the significance of the graph.
- Stability:
- If needed, glue the base and the bars securely to ensure stability during the exhibition.
This 3D bar graph model not only provides a clear representation of subject marks but also adds an engaging visual element to your science exhibition.